Please scroll down
Information Graphics
Intro Unit
The first three weeks of classes will lay the groundwork for what is to follow. We will learn to collect information from reliable sources, analyze data and begin to make spreadsheet calculations. We will begin to explore the potential for visuals to enlighten and enliven our information. We will conclude this short unit by focusing on how to use Adobe Illustrator, which will be our primary software for creating Information Graphics over the ensuing weeks, and laying the groundwork for our interactive data visualizations, which we will produce at the end of each unit and which will culminate in your J464 portfolio website.
| Session | Day | Date | Topic |
|---|---|---|---|
01 |
Mon. | Jan. 8 | Introduction |
02 |
Wed. | Jan. 10 | Foundations |
03 |
Wed. | Jan. 17 | Form and function |
04 |
Mon. | Jan. 22 | Illustrator boot camp |
05 |
Wed. | Jan. 24 | HTML/CSS basics |
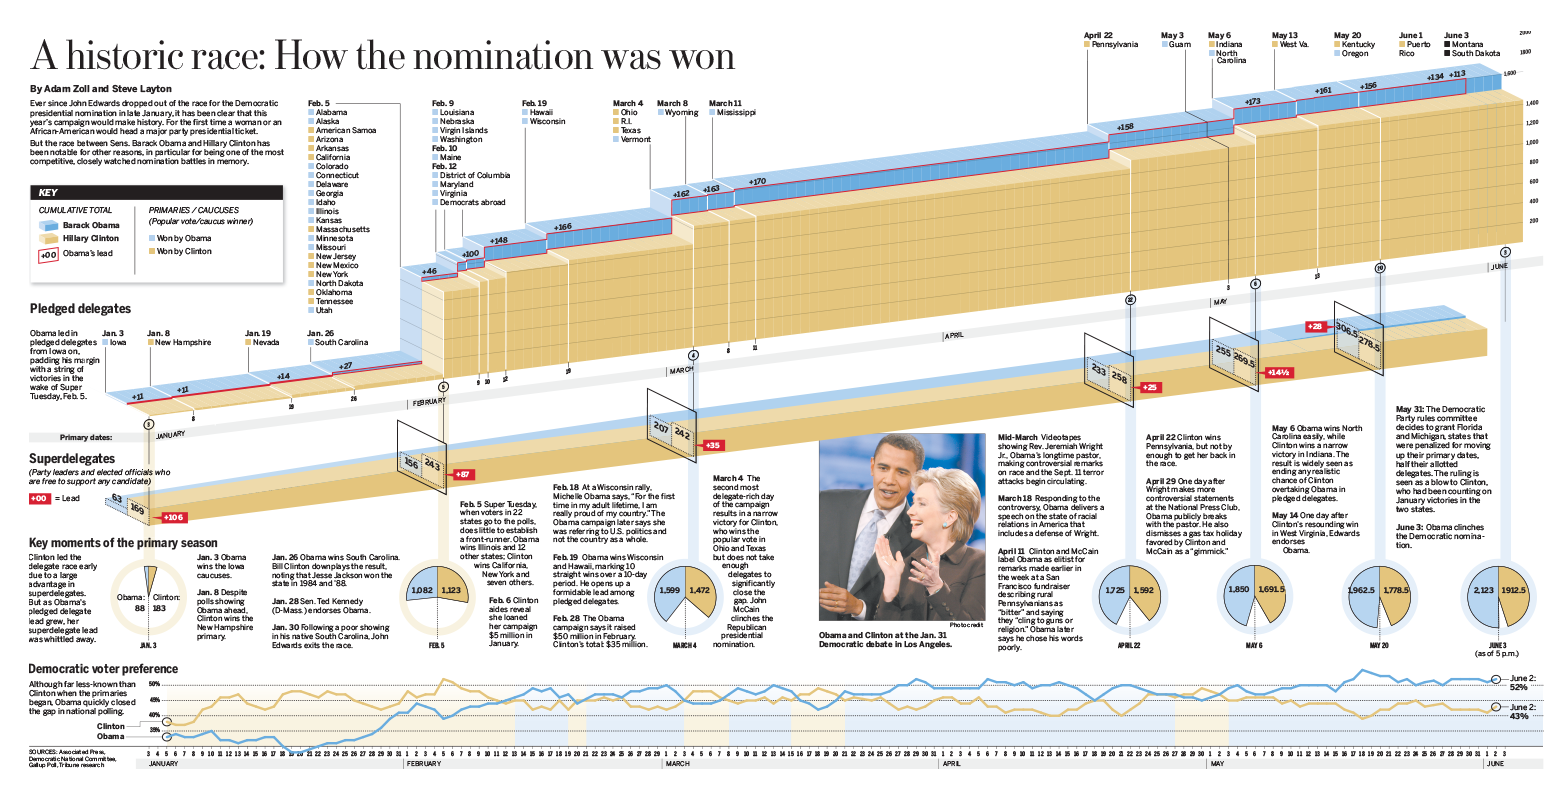
Chart Unit
The visual representation of quantifiable data remains the crux of informational graphics, and represent the bread and butter of most modern graphics departments. We’ll take a close look at how various chart formats can be used to best effect, how these formats can be combined to convey complex data and how to design effective graphics based on creating a strong and appropriate visual focus.
| Session | Day | Date | Topic |
|---|---|---|---|
06 |
Mon. | Jan. 29 | Charts intro |
07 |
Wed. | Jan. 31 | Nuts + Bolts |
08 |
Mon. | Feb. 5 | Line charts |
09 |
Wed. | Feb. 7 | Pie charts |
10 |
Mon. | Feb. 12 | Comparing data |
11 |
Wed. | Feb. 14 | Graphics packages |
12 |
Mon. | Feb. 19 | Deadliner 1 |
13 |
Wed. | Feb. 21 | Revise + edit |
14 |
Mon. | Feb. 26 | Flourish |
Map Unit
Our second area of study in this course concerns cartography — the graphical representation of where things are and data based on georgraphy or political boundaries. There are a number of different kinds of maps, ranging from simple locators to complex data maps.
| Session | Day | Date | Topic |
|---|---|---|---|
15 |
Wed. | Feb. 28 | Maps intro |
16 |
Mon. | March 4 | Map style |
17 |
Wed. | March 6 | Locators |
18 |
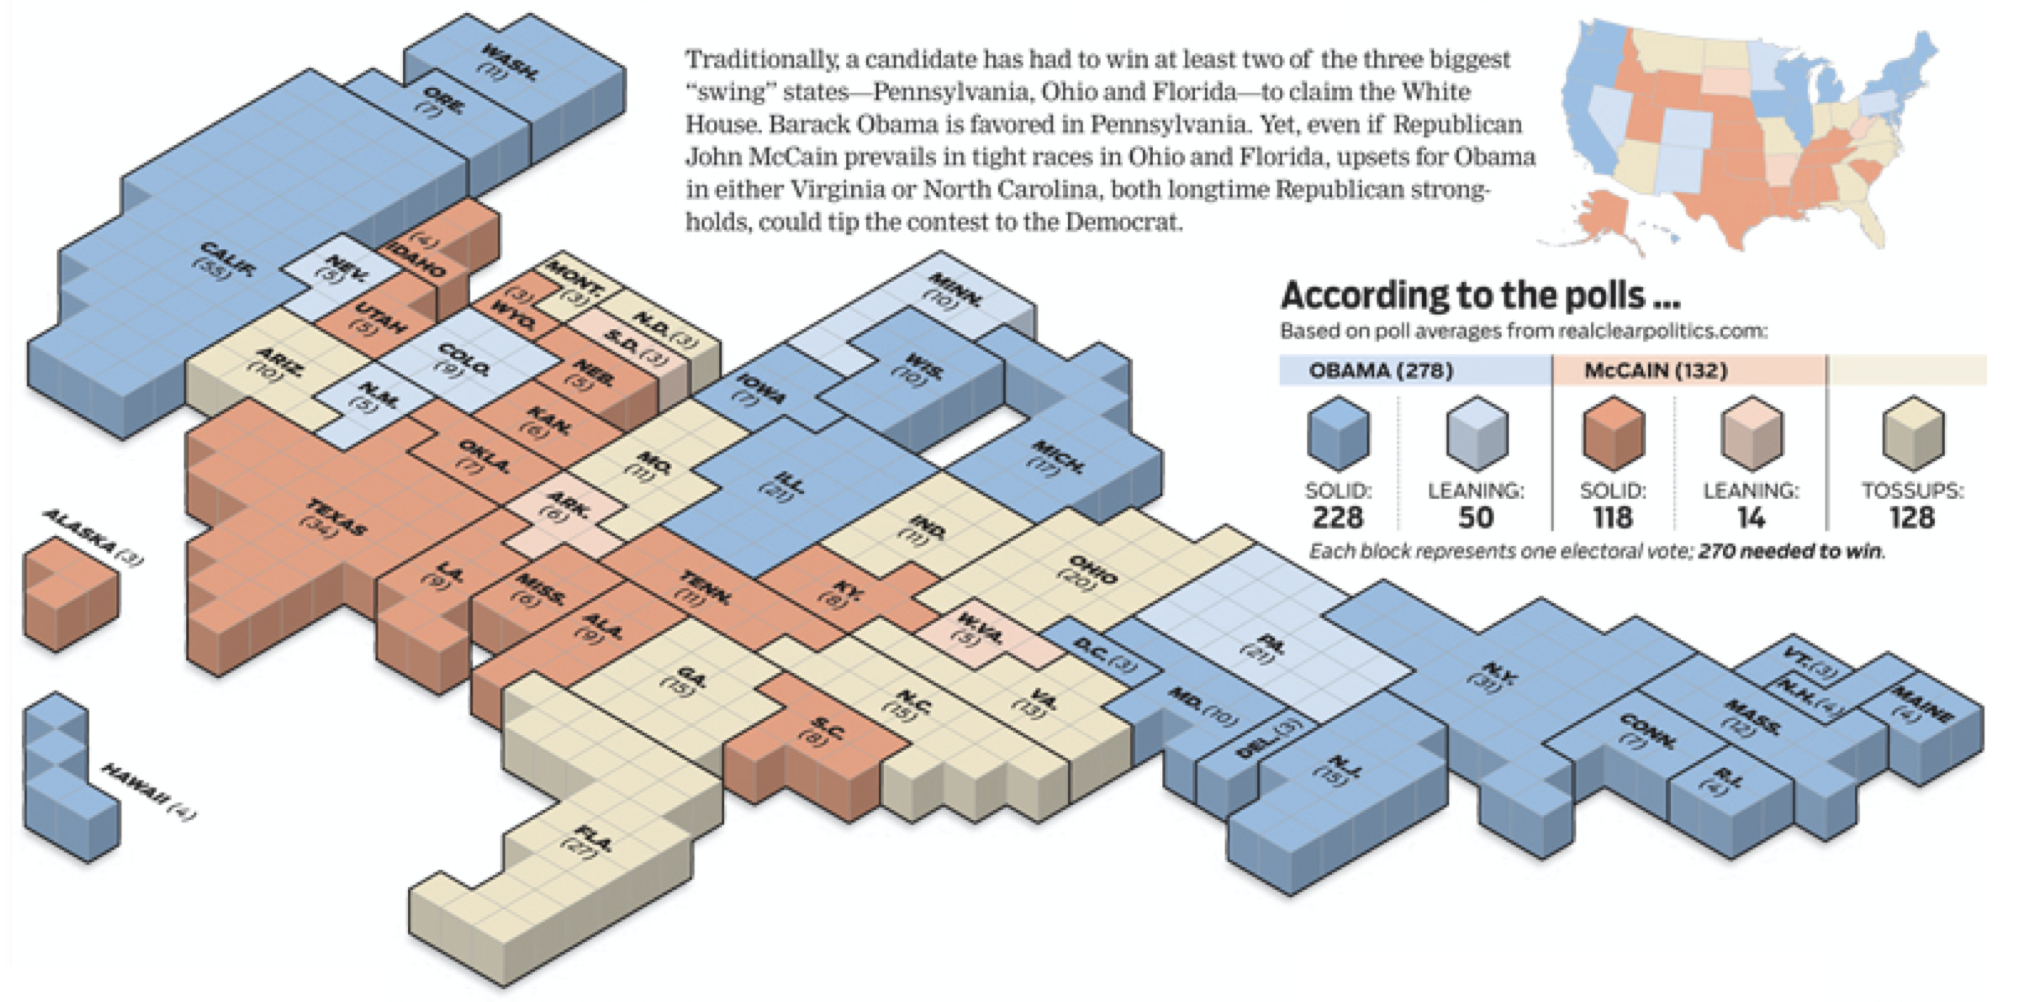
Mon. | March 18 | Choropleths |
19 |
Wed. | March 20 | Proportional symbols |
20 |
Mon. | March 25 | Deadliner 2 |
21 |
Wed. | March 27 | DataWrapper |
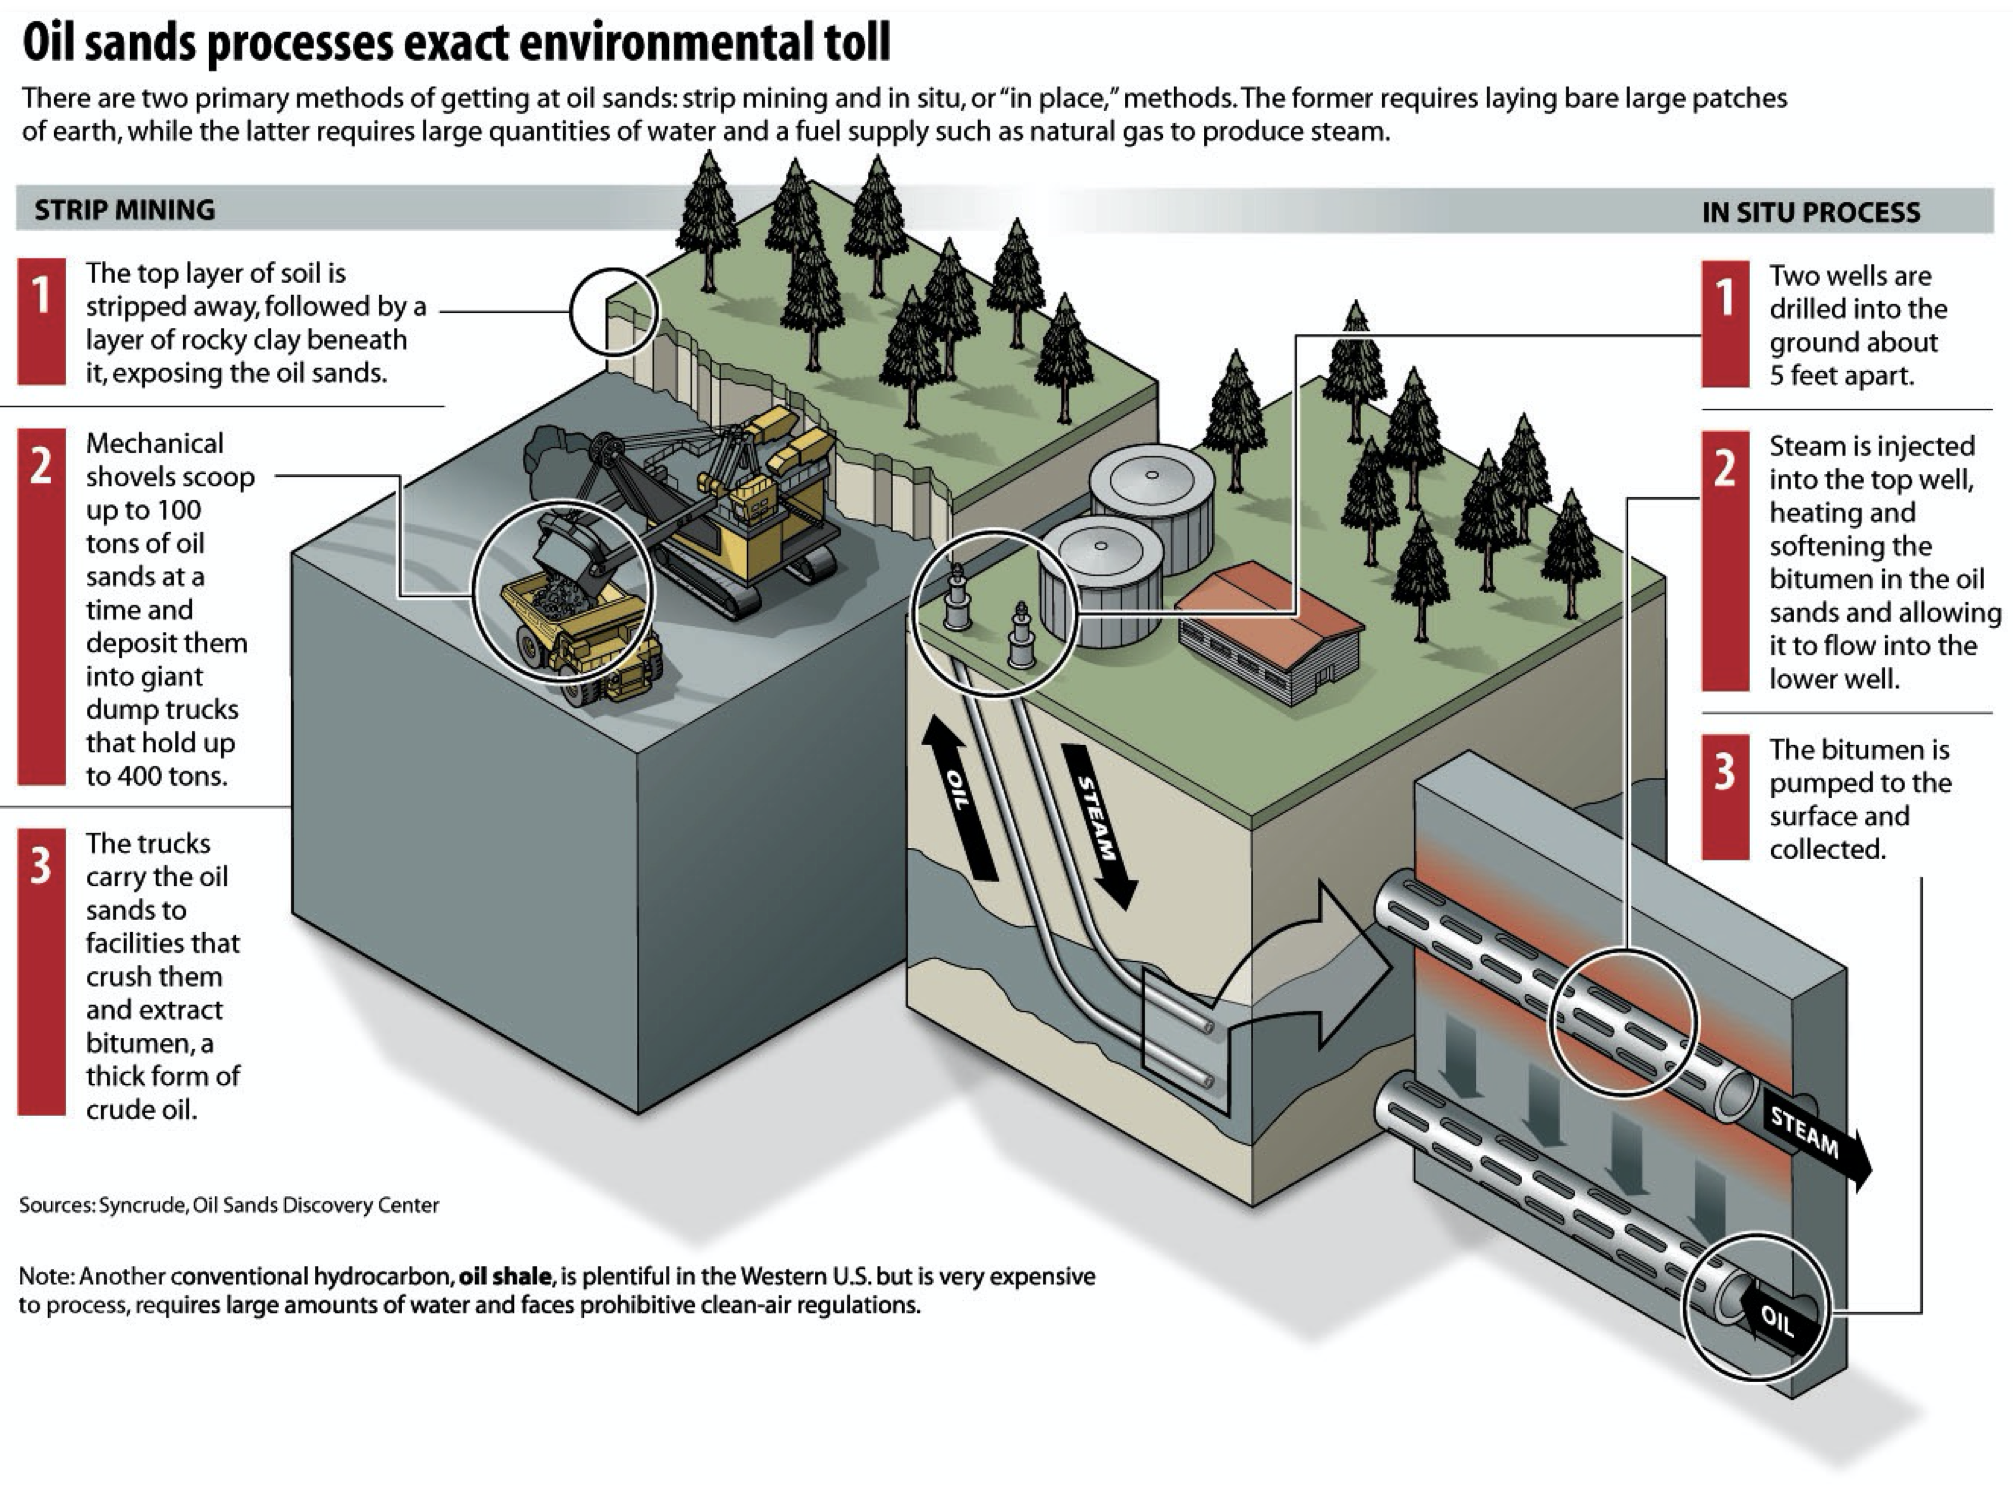
Diagram Unit
Much of the power of informational graphics lies in their ability to describe in great visual detail how something works or how an event occurred, taking readers to places they wouldn’t otherwise be able to go. Here, the ability to illustrate clearly and effectively becomes paramount.
| Session | Day | Date | Topic |
|---|---|---|---|
22 |
Mon. | April 1 | Icons |
23 |
Wed. | April 3 | Timelines |
24 |
Mon. | April 8 | Diagrams intro |
25 |
Wed. | April 10 | Perspective |
| 26 |
Mon. | April 15 | Case studies |
27 |
Wed. | April 17 | Deadliner 3 |
Interactive Unit
The news industry has shifted away from GUI software, like Adobe Flash, toward more code-based interactive graphics, using JavaScript libraries like D3 and jQuery. This requires a good deal of programming knowledge, and is beyond the scope of this class. However, we will introduce, in our final week, some basic JS libraries to help create interactive content. The semester will culminate with your J464 website, built from a customizable template, which will showcase your creative work in the class.
| Session | Day | Date | Topic |
|---|---|---|---|
28 |
Mon. | April 22 | Javascript |
29 |
Wed. | April 24 | Finalizing |
This syllabus
I have mapped out what I hope and believe to be an achievable schedule for this course that will keep everybody working at a steady pace. Because there are wide variations in your experiences coming in, and because each class is always different, I reserve the right to amend this syllabus to reflect any shifting realities we may encounter. I ask for your help in this endeavor, and I will be certain to let you know in advance if and when there will be changes to deadlines or schedule.
Be sure to refer to Canvas for specific deadlines for assignments and quizzes, and to download the materials we will be using in our class work.